Non-targeted metabolomics based on Orbitrap GC-MS
Stefan Weidt, 2 Bogusia Pesko, 2 Cristian Cojocariu, 1 Paul Silcock, 1 Richard J. Burchmore, 2 and Karl Burgess2
1Thermo Fisher Scienti_c, Runcorn, UK
2Glasgow Polyomics, University of Glasgow, Glasgow, UK
Key words
Forensic science; metabolomics; multivariate statistical analysis; Q Exactive GC system
introduction
Metabolomics aims to characterize and quantify intact small molecule metabolic pathways or metabolites in biological systems. The metabolite group contains a mixture of small molecules (including amino acids, sugars and phosphates, biogenic amines and lipids). Non-targeted metabolomics is challenging because it requires the quantification and quantification of hundreds of different classes of compounds with limited empirical knowledge about these metabolites. Therefore, it is necessary to use a detection system that can sensitively detect a specific molecule in a non-targeted manner, and can provide accurate mass information for confirming the unknown and structurally analyzing it.
Gas chromatography-mass spectrometry (GC-MS) is often used for metabolomics analysis based on its own merits, especially its chromatographic resolution, reproducibility, peak capacity, and ease of use of mass spectrometry libraries. GC provides superior chromatographic separation for the discovery of biomarkers in non-targeted metabolomics, but due to the current lack of support from high-end mass spectrometers, it limits the availability of muscle tissue for analysis of complex samples (eg, mammals) Dynamic range, accurate mass and scan speed. In view of the polar nature of most important metabolites, they must be derivatized to allow them to be effectively volatilized to ensure good chromatographic separation. Metabolomics analysis, especially clinical metabolomics, requires high throughput and advanced automation techniques.
This study demonstrates the complete non-targeted metabolomics workflow of the new Thermo ScientificTM OrbitrapTM GC-MS, which detects biomarkers in rat models to determine their time to death. Time to death (PMI) inference is one of the most critical and difficult tasks in forensic investigations, especially when the temperature of the body is balanced with the ambient temperature. Due to the inaccuracy of the methods currently used to determine PMI and the visual inspection of corpses. Therefore, an experimental method was established to use a durable biomarker to infer the time of death to aid in forensic investigation.
The GC-MS unit uses an Orbitrap-based detector for ultra-high quality resolution, sub-ppm mass accuracy, wide dynamic range, and a certain scanning speed for efficient quantification of extremely complex metabolomics samples. High resolution, consistent mass accuracy, and fast scan speed are key factors for stable data deconvolution to detect compounds in overlapping TIC peaks for non-targeted metabolomics analysis. Electron bombardment ionization (EI) cracking mode is also suitable for matching based on a widely used NIST library and Wiley library to identify compounds while providing accurate mass for more in-depth characterization.
Instrument and method settings
Sample Preparation
Samples were taken from the muscle tissue sections of each rat leg, and necropsy and sampling were performed in chronological order. Metabolites from homogenized tissue sections were extracted with chloroform/methanol/water (1:3:1) and incubated for 1 hour under ice. Protein and DNA are pelleted by centrifugation. The supernatant was removed and stored at -80 °C until use.
Sample derivatization
Pipette 200 μL of the extract into a 1.5 mL borosilicate glass vial and cap with a 9 mm screw cap. The sample was then placed in a Thermo ScientificTM Reacti-VapTM evaporator and dried at a low flow rate of nitrogen for 30 min at 30 °C. All of the following derivatization steps were performed using the Thermo ScientificTM TriPlusTM RSH automated sample processor.
Add 20 μL of 20 mg/mL (w/v) methoxyamine hydrochloride in pyridine to each dry vial. The vial was vortexed for 10 seconds and incubated for 60 min at 30 °C. After the methoxylation step is completed, a mixture of 30 μL of MSTFA +1% TMCS (N-methyl-N-(trimethylsilyl)trifluoroacetamide + 1% trimethylchlorosilane) is added to further vortex. Spin for 30 seconds. The vials were incubated at 45 °C for 60 min for silanization. The sample was cooled to room temperature for injection.
GC-MS analysis
All experiments were performed using a Thermo ScientificTM Q ExactiveTM GC combined quadrupole Orbitrap mass spectrometer. Injection with TriPlus RSH autosampler using Thermo ScientificTM TRACETM 1310 GC Chromatograph and Thermo ScientificTM TraceGOLDTM TG-5SilMS 15 m × 0.25 mm ID × 0.25 μm Thin Film Capillary Column (P/N: 26096-1301) Perform chromatographic separation. Additional details of instrument parameters are given in Tables 1 and 2.
Table 1. GC temperature program
TRACE 1310 GC parameters |
Injection volume (μL) | 1.0 |
Liner | Single taper (P/N 453A1345) |
Entrance (°C) | 250 |
Entry module and mode | SSL, offload 1:60 |
Carrier gas (mL/min) | He, 1.2 |
Column oven temperature program |
Temperature 1 (°C) | 70 |
Hold time (min) | 2 |
Temperature 2 (°C) | 325 |
Speed ​​(°C/min) | 10 |
Hold time (min) | 8.5 |
Table 2. Mass spectrometer parameters
Q Exactive GC mass spectrometer parameters |
Transmission line (°C) | 275 |
Ionization type | EI |
Ion source (°C) | 230 |
Ionization energy (eV) | 70 |
Acquisition mode | Full scan |
Mass range (m/z) | 50–750 |
Mass resolution (FWHM at m/z 200) | 60,000 |
Mass number of mass internal standard (m/z) | 207.03235 |
data processing
The data analysis process first uses MSConvert (part of ProteoWizard Suite 1) to convert the raw data files into MzXML files. Peaks are extracted using the XCMS package 2 and centWave algorithms. The detected peaks are output in PeakML format, and then the detected peaks are post-processed using the MzMatch.R package (filtering the minimum detection value, relative standard deviation, and grouping of the EI fragment groups for each group of repeated injections) match). 3 The generated text file output is processed by IDEOM software 4 for single-variable statistical processing, and multi-variable statistical processing is performed using SIMCATM 13.0.35. Peak cluster identification and resolution using Thermo Scientific deconvolution software.
Results and conclusions
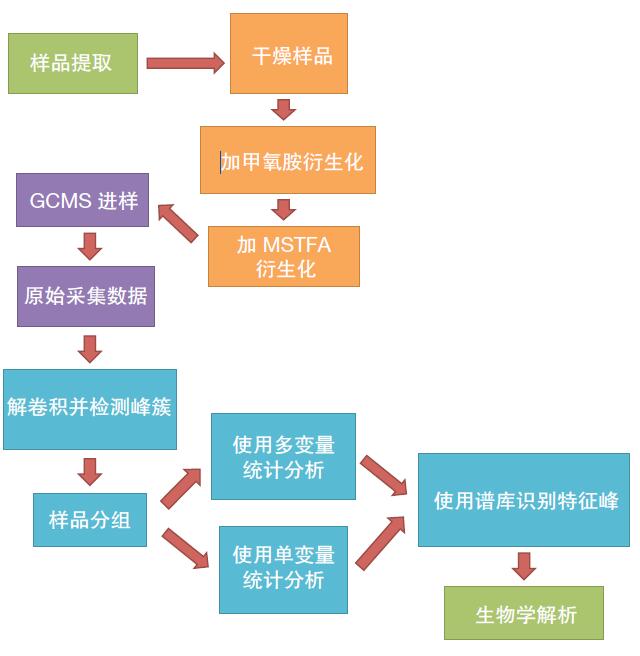
Eight rat corpses were placed at room temperature for four days. Muscle tissue was extracted daily for analysis, and changes in metabolite concentrations in 16 samples were detected to analyze the degree of corpus decomposition. Random analysis of the samples to reduce systematic errors. The analytical process after metabolomics optimization is shown in Figure 1.
Figure 1. Workflow of the Q Exactive GC System Metabolomics Study. The division of tasks in the workflow package is displayed in different colors: green for biotech personnel; orange for laboratory technicians; purple for instrument operators; blue for biological information processors.
Figure 2. GC-MS chromatograms of rat muscle tissue samples after 0–3 days of metabolism (increased from top to bottom), with the X-axis as retention time and the Y-axis as intensity (fixed to 1E9 count). For example, note the change in peak intensity over time in the highlighted area.
Compound discovery stage
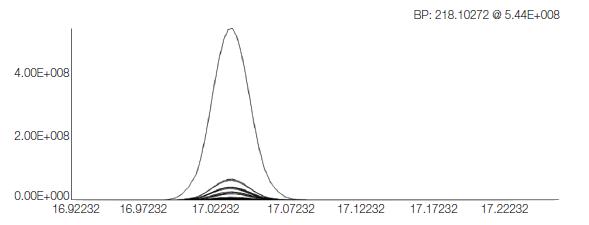
The Q Exactive GC system acquired a full scan chromatogram of each sample (Figure 2). The system captures full-scan chromatograms of metabolites at different concentrations over a wide dynamic range without losing any accurate mass information. Extract each EI peak cluster using automatic peak selection (in combination with XCMS and MzMatch.R). In this step, 1193 distinct peak clusters have been detected and preliminary quantification is performed with an intensity threshold of 100,000. An example of a deconvoluted peak cluster is shown in Figure 3.
Figure 3. The deconvoluted peak cluster is inferred to be identified as tyrosine.
Quantitative stage
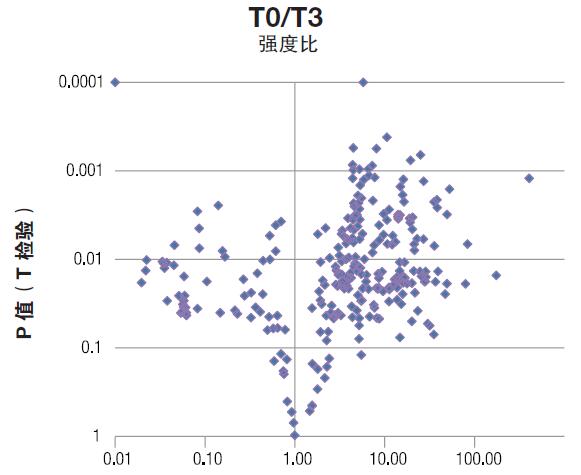
The results were first analyzed using a single variable statistical method. Compare each time point and time zero with the Student's t test. The average T0 intensity of each metabolite was set to 1, and the fold change was shown as a multiple of 1 to facilitate comparison of metabolites with significantly different intensities (Figures 4 and 5). A significant change in the average intensity of 272 metabolites has been detected (P value less than 0.05), and an example of a quantitative matrix containing the detected peak clusters is shown in Table 3.
Figure 4. Volcanic map of metabolites with significant changes. Each metabolite is represented by a dark blue diamond. The intensity ratio (X-axis) is the fold change of the metabolite at T0/T3, and the Y-axis shows the P value of the metabolite. Thus, the metabolites in the upper right and upper left corners are the most variable and most statistically significant metabolites.
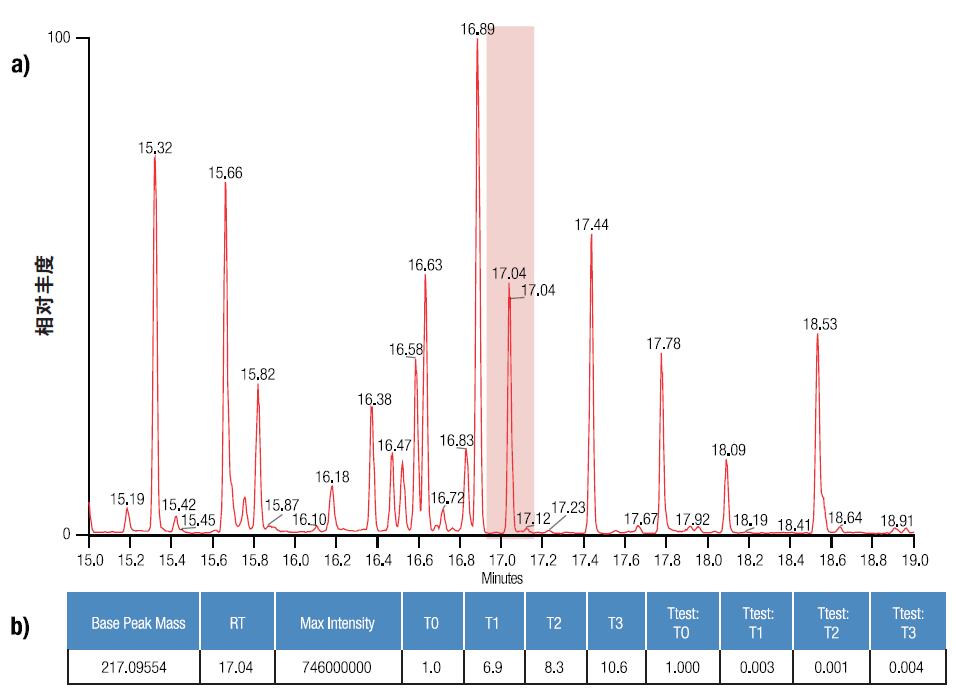
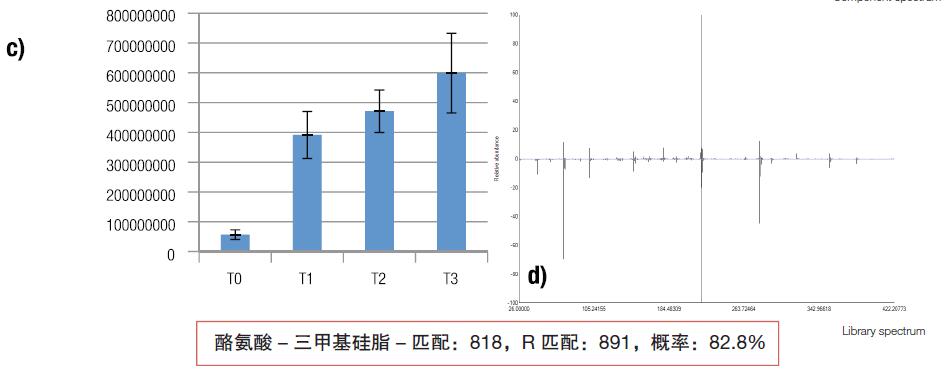
Figure 5. Summary of the data analysis process. Peak detection and deconvolution of the raw data (a), which is then displayed as a base peak in the IDEOM metabolomics software (b), containing quantitative information and quantitative statistical methods. The IDEOM software also provides quantitative graphical information (c), which shows the mean intensity and standard deviation for each condition, in this case four identical biological samples for each condition. Using the NIST library to attribute the target peak, (d) confirms the results of the matching of the mass spectral data, and the Nist score value of the derivatized amino acid is included below the figure.

Table 3. Quantification matrix of detected peak clusters. The base peak (the peak with the strongest peak in the cluster), the retention time (RT), and the maximum intensity detected are listed in columns 1–3. Normalize the intensity of T0 to 1, and the intensity at other points in time is compared to the T0 intensity and is displayed in different colors as appropriate, see columns 4–7. Columns 8–11 contain the T-test P-value for each ratio.
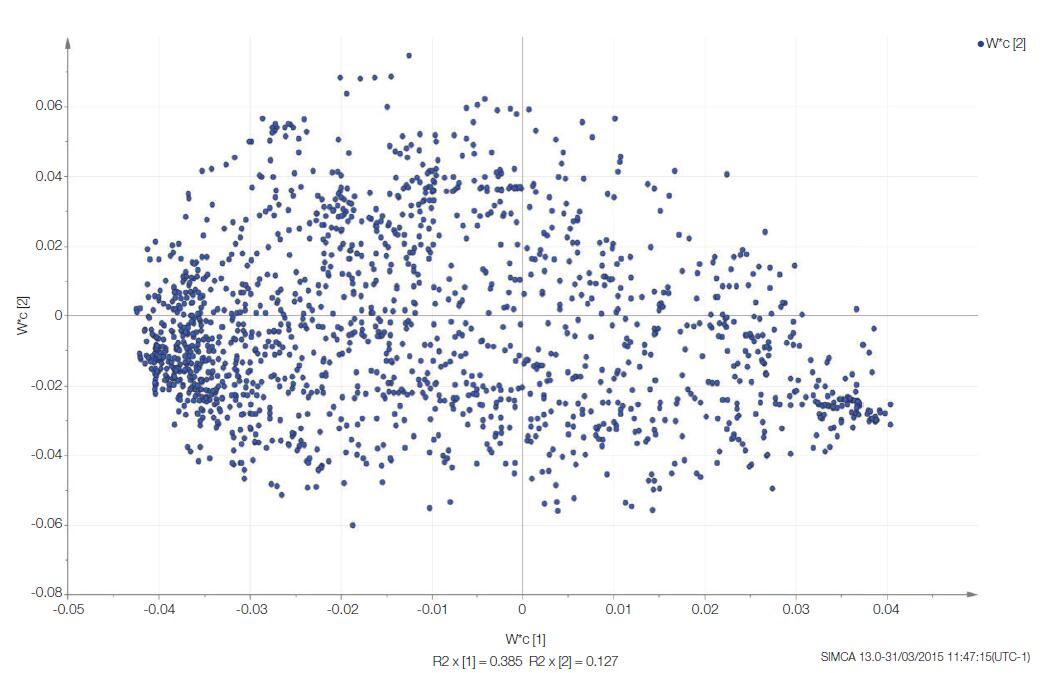
Multivariate statistical analysis was performed using SIMCA software. 5 Convert the conclusion data into a more intuitive logarithmic value, set the Y category to each time point, and generate a partial least squares discriminant analysis (PLS-DA) model of the data. The software generates a score map and a load map to show clustering and separation (Figure 6) at each time point along the principal component. From this analysis, samples taken immediately after death (RAT_T0) were clustered together, and there was a significant difference from the decomposed rat samples (T1–T3). Group clustering and continuous decomposition can be observed from T1–T3 samples. The displacement on the X or Y axis represents the effect of a metabolite on the separation between sample groups in the fractional plot. In this example, the X axis separates T0 from T1–3, which separates T1, T2, and T3 (Figure 6). Each blue dot on the load map represents each detected metabolite containing the EI fragment ion cluster (Figure 7).
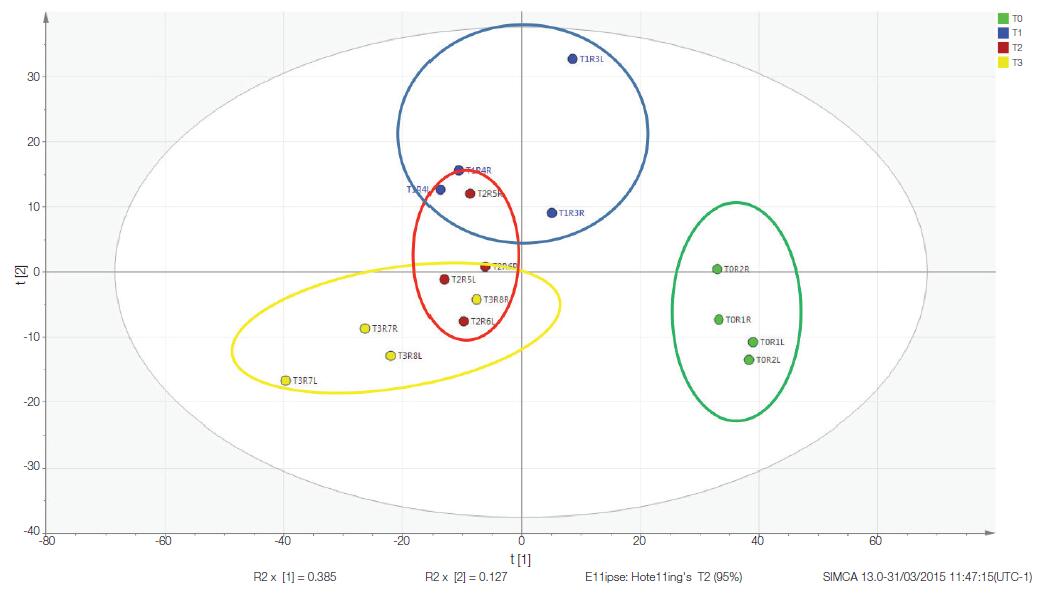
Figure 6. PLS-DA model for decomposing data. The model is a supervised multivariate analysis that folds high-dimensional data (for example, a large number of metabolites with different intensities) into several principal components that cover major changes in the data set. In this example, the X-axis is the principal component 1, and the Y-axis is the principal component 2. Note that this study properly clustered the samples, each group gathered together, and T0 was clearly separated from the other groups.
Figure 7. Load map of the PLS-DA model. The metabolites were clustered according to the size of the metabolites (represented by the blue origin) for group separation, as shown in Figure 6. For example, the rightmost metabolite is very useful for defining a T0 sample.
Table 4. List of putative IDs for increasing levels of metabolites during decomposition. Compound confirmation can be performed by accurate mass and molecular formula estimation. Putrescine can only be detected under high resolution and high quality precision and deconvoluted from background ions.
Speculative compound ID | RT ( min ) | NIST forward matching | Compared with T0 Increase multiple | Base peak fragment Elemental composition | Ppm precision (base peak) | Ppm precision (molecular ion) |
L threonine, 3TMS | 10.71 | 795 | 2.8 | C9H24ONSi2 | 0.27 | 0.13 |
L aspartate, 3TMS | 11.78 | 707 | 7.0 | C9H22NO2Si2 | 0.18 | 0.34 |
L methionine, 2TMS | 12.40 | 749 | 15.0 | C7H18NSSi | 0.24 | 0.04 |
L glutamine-3TMS | 15.32 | 815 | 2.0 | C7H14NOSi | 0.53 | 0.21 |
Putrescine, 4TMS | 16.18 | 870 | 2.0 | C7H20NSi2 | 0.05 | N/A |
Lysine, 4TMS | 16.88 | 732 | 5.1 | C8H18NSi | 0.19 | 0.05 |
Identification stage
Metabolites that have undergone significant changes are identified by the existing commercial library (NIST), which are first matched to amino acids and compounds associated with decomposition (Table 4). The entire process based on multivariate statistical analysis is summarized in Figure 5, where the peaks are understood to be convoluted, quantified, and identified. All selected compounds scored higher (> 700) and used exact masses for fragment matching, further improving the accuracy of library matching results (Table 3).
in conclusion
The workflow sequence for the Q Exactive GC system presented here is sample preparation, automated derivatization, GC separation and mass spectrometry, data analysis, and results reporting. This workflow makes the Q Exactive GC system a unique analytical tool for volatile compounds and metabolomics analysis of derivatized non-volatile compounds.
Superior chromatographic separation, reproducible chromatographic separation combined with fast data acquisition make the Q Exactive GC system an ideal platform for complex metabolomics analysis.
Ultra-high resolution, consistent sub-ppm accurate mass measurements provide reliable and highly selective analysis of multiple metabolites present in complex biodegradable matrices.
The wide dynamic range provides high sensitivity and continuous detection of metabolites in the sample, and the mass accuracy is unaffected, while providing accurate relative quantification of the detected metabolites.
The compounds can be initially identified based on the EI data obtained from existing commercial libraries, allowing the researchers to evaluate the results. At the same time, the exact mass obtained allows further analysis of the data, such as using a lysis assay (eg, Mass Frontier) or by using AN 10457_C_GCMSMS_201508Y to further confirm the target compound. In this case, the time-dependent evolution of the amino acid signal provides a simple biochemical forensic assay for detecting death time.
Acknowledgement
Thanks to Dr. Mark McLaughlin for providing us with research rats.
references
1. ProteoWizard Page. http://proteowizard.sourceforge.net/
(accessed Apr. 22, 2015).
2. CA Smith, EJ Want, GC Tong, R. Abagyan, and G. Siuzdak. XCMS: Processing Mass Spectrometry Data for Metabolite Profiling Using Nonlinear Peak Alignment, Matching, and Identification. Anal. Chem.
2006, 78 (3), 779–787.
3. Richard A. Scheltema, Andris Jankevics, Ritsert C. Jansen, Morris A. Swertz, and Rainer Breitling. PeakML/mzMatch: A File Format, Java Library, R Library, and Tool-Chain for Mass Spectrometry Data Analysis. Anal. Chem.
2011 83 (7), 2786–2793.
4. Creek, DJ, Jankevics, A., Burgess, KEV, Breitling, R., and Barrett, MP IDEOM: an excel interface for analysis of LC-MS based metabolomics data. Bioinformatics.
2012. 28 (7), 1048–1049.
5. SIMCA Page, Umetrics Website. http://
(accessed Apr. 22, 2015).
Orbitrap Group Club Thermo Fishery Mass Spectrometry Application Technology Group
Thermo Fisher Scientific (China) Co., Ltd.
National Service Hotline:
800 810 5118
400 650 5118 (support mobile phone users)
Food Addictives Powder
China: In accordance with Article 54 of the Food Hygiene Law of the People's Republic of China, Article 28 of the Hygiene Management Measures for Food Additives, Article 2 of the Hygiene Management Measures for Food Nutrition Enhancers and Article 99 of the Food Safety Law of the People's Republic of China, food additives are defined as: Food additives refer to artificial or natural substances added to food for the purpose of improving quality, color, aroma and taste of food and for the purposes of preservative, fresh-keeping and processing. According to GB 2760-2014 National Food Safety Standard for The Use of Food Additives, food additives are defined as "artificial or natural substances added into food for the purpose of improving food quality, color, aroma and taste, as well as for the needs of anti-corrosion, fresh-keeping and processing technology. Spices for food, base agents in gum-based confectionery and processing AIDS for food industry are also included.
Food Addictives Powder,Tryptamine Powder,Beta-Nicotinamide Mononucleotide Powder,Sucralose Bulk Food Additives
Shaanxi YXchuang Biotechnology Co., Ltd , https://www.peptide-nootropics.com
